01
Own your data
Most trading apps are a thin skin over somebody else’s feed. When the feed stops, the app is a blank rectangle. Here the series is a file you keep.
iOS · Android · fully offline
Candle charts you own. Deterministic rules you write yourself. A position-size calculator that refuses to let you over-risk. And a journal that tells you the truth afterwards — including when it is unflattering.
Coming to the App Store and Google Play. No ads, no purchases, no account.
The part most apps skip
A trading app that hides what it cannot do is selling something. This one states it on its own About page, and the app is built so the statement stays true.
Verbatim, from the About page
“TradeWorty Tools is an offline analysis and journaling tool. It is not a broker, it is not connected to any market, and it does not provide investment advice. Prices come from files you import or values you enter. Rule results are historical checks on that data, not predictions. Trading involves risk of loss.”
What it does not do
What it does instead
01
Most trading apps are a thin skin over somebody else’s feed. When the feed stops, the app is a blank rectangle. Here the series is a file you keep.
02
A signal is a rule you wrote: EMA(9) crosses above EMA(21), RSI under 65, ATR above its own average. The app marks where it fired. It never says “buy”.
03
Size comes from the stop, never the other way round. Guardrails are visible before the trade is logged, not discovered afterwards.
04
The journal holds the plan next to the fill, and the statistics show what you actually do — including the trades where you did not follow your own checklist.
Drawn by hand, not by a chart library
Every candle, axis, indicator and crosshair in the app is a custom painter — no chart package, no WebView. Move the pointer across the panel below: this is the same geometry the app uses, on real bars from the bundled sample series.
Rendering rules from the spec
Indicators, with exact formulas
SMA · EMA · RSI (Wilder) · ATR (Wilder)
MACD(12,26,9) · Bollinger(20,2, population σ)
Volume · swing highs and lows
Each one ships with a unit test against a hand-computed fixture, because a number that disagrees with your platform destroys trust in the whole app.
The calculator is the gate
Type your numbers. This is the app’s own arithmetic, formulas included: the size is rounded down to the instrument’s unit step, and the risk you actually take is recomputed from that rounded size — never from the ideal one.
A worked example from the spec: 12 400 at 1%, entry 1.0838, stop 1.0800 → 38 pips, 124.00 risk, 0.32 lots, 1:2.6 to target 1, breakeven 27.8%. The app returns exactly these numbers, and a unit test keeps them there.
Daily loss limit, maximum open risk, trades per day, consecutive-loss cooldown. They colour the desk and flag the trade — they never block your own journal, because the app does not control your broker and pretending otherwise would be dishonest.
The same stop at 0.25 / 0.5 / 1 / 2 % sits under the calculator, read-only, so over-sizing looks as absurd as it is.
Signal Lab
Up to six typed conditions combined with AND, a stop model, a target model. The engine walks the bars you loaded, in order, and never reads a bar it could not have seen at the time.
The run below is real output from the app, on the bundled series
R distribution of the resolved signals
Sample data · BTC/USD · H1 · 1 500 bars · 2026-06-25 – 2026-08-27
Historical check on the data you loaded. Not a prediction, not advice.
A signal on a bar enters at the open of the next bar. Entry at the signal bar’s close is forbidden, because it is not reachable in reality — and a test truncates the series to prove the result never changes.
If one bar touches both the stop and the target, the outcome is recorded as ambiguous and counted as a loss. The app says so on screen rather than quietly rounding in your favour.
Fewer than 30 signals shows “Too few signals to mean anything.” A run over fewer than 200 bars is refused with an explanation, not a spinner that never ends.
Five tabs, one visual system
Dark carbon surfaces, hairline borders, one cyan accent that means “interactive”, and tabular monospace numbers that never jitter. Every screen below is the running app, photographed as it is — no mockups, no invented numbers.
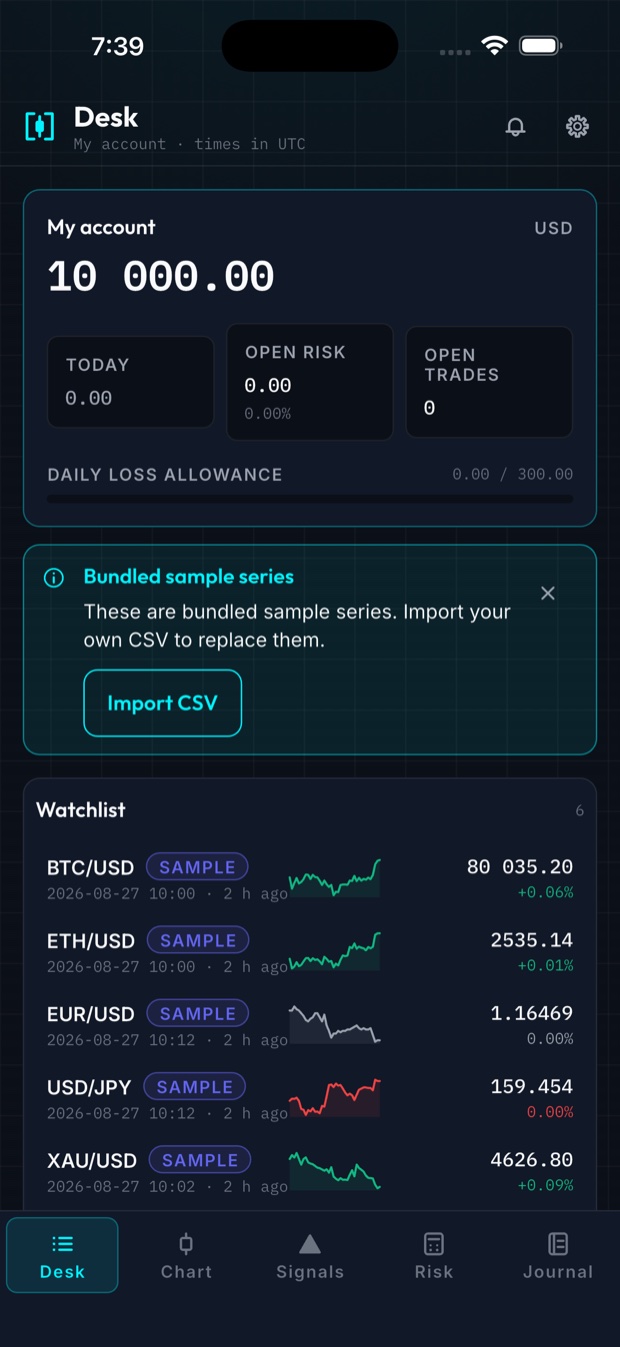
Balance, today’s realised P&L, open risk and how much of the daily loss allowance is gone — before anything else. Under it, the watchlist: each instrument with its source badge, the time of its last bar and how old that bar is.
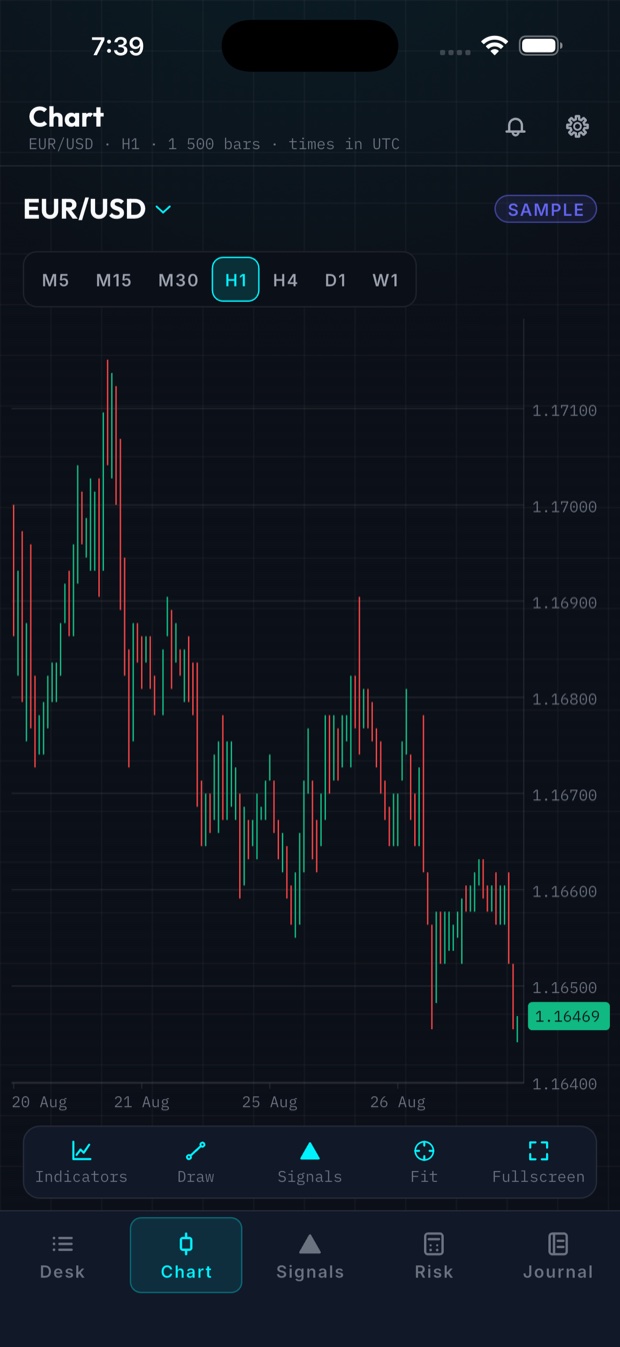
Candles, indicators, drawings and the crosshair are one painter stack written from scratch. Pan, pinch, double-tap to fit, long-press for the crosshair, and rotate into fullscreen landscape with the visible window preserved exactly.
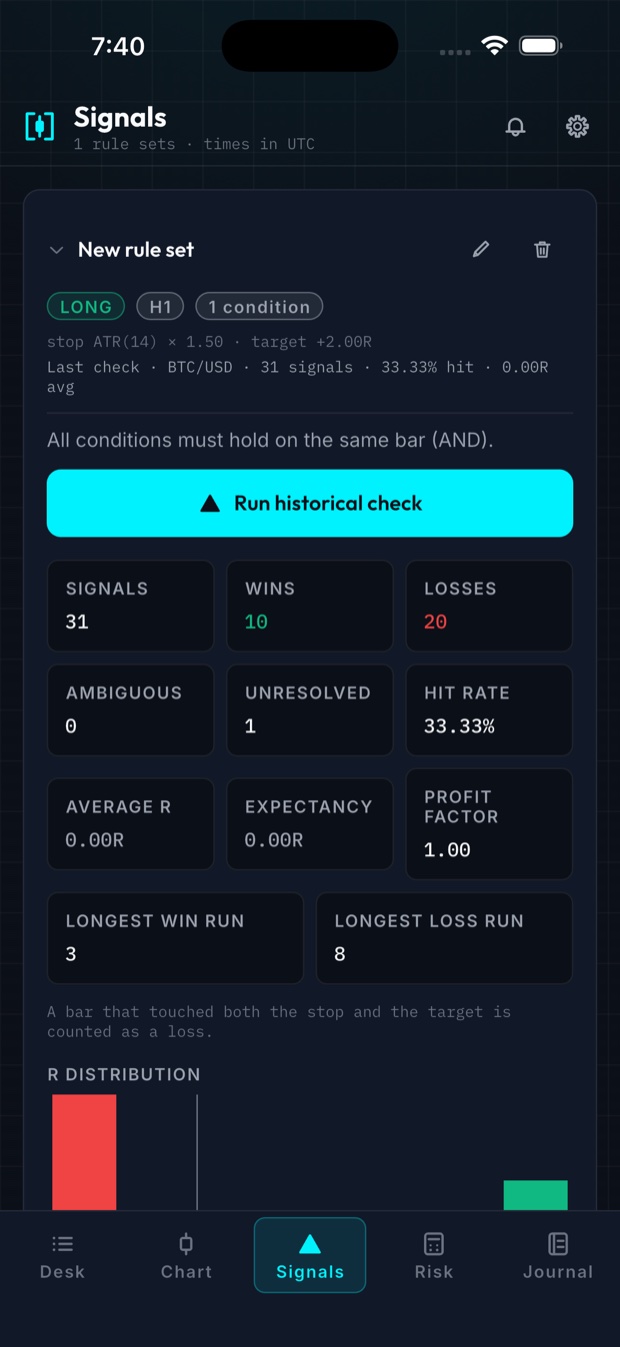
Build a set from typed conditions, pick the stop and target models, and run it. The check happens on a background isolate with a progress bar and a cancel that really cancels, then reports counts, hit rate, expectancy and the distribution — with the scope line naming the data it used.
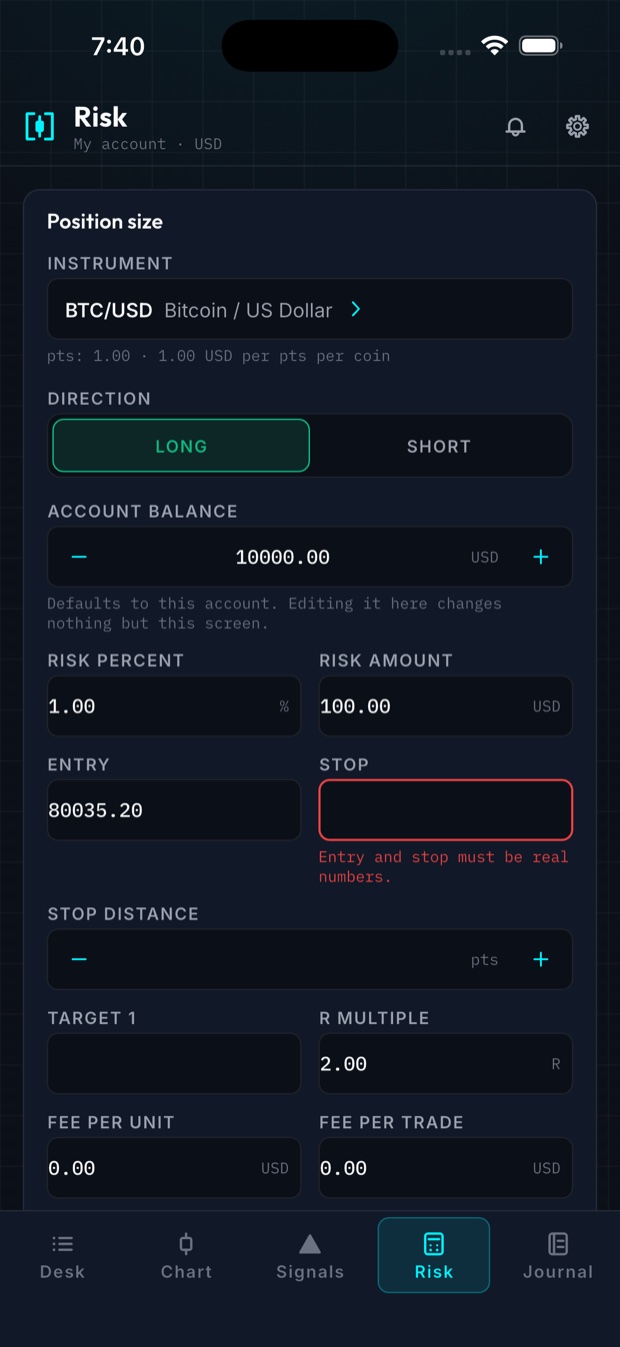
Instrument, direction, balance, risk, entry, stop, up to three targets. Every output carries its formula, the size rounds down to the unit step, and the risk you actually take is the number printed largest.
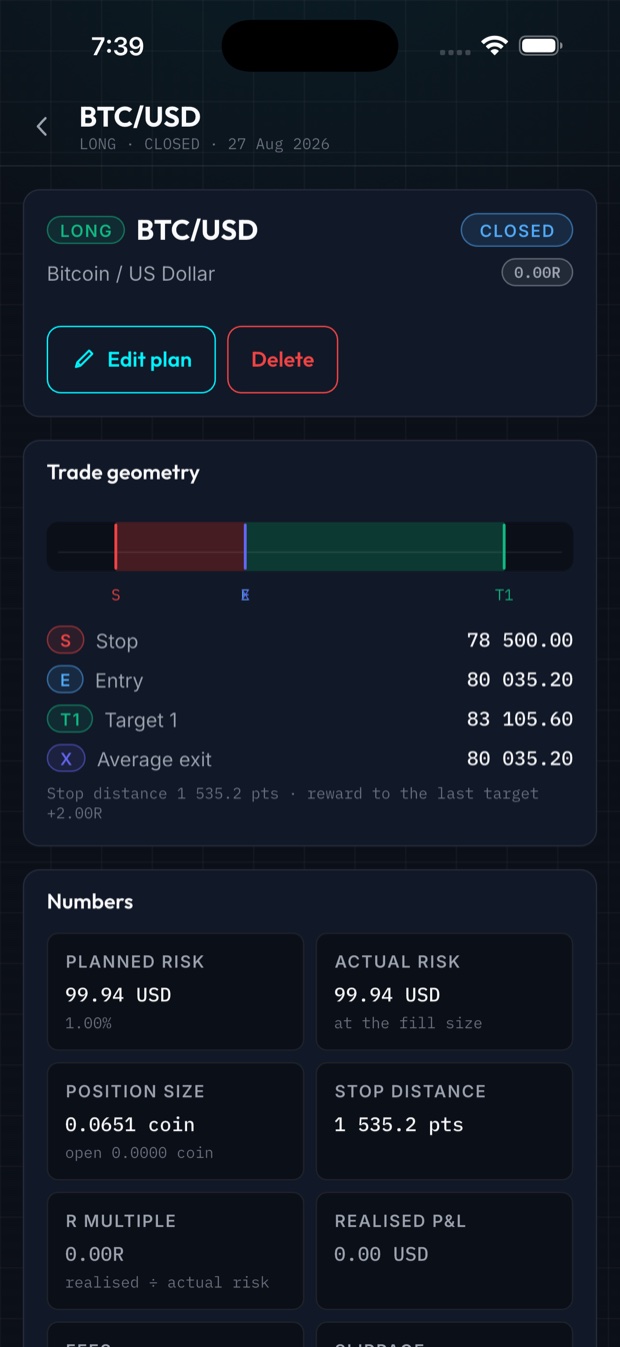
A trade page shows the geometry of the trade as a small scale, then the numbers: planned risk against actual risk at the fill, position size, stop distance, R multiple, realised P&L, fees and slippage. Partial exits are first-class, and every edit after the close is stamped with its time.
The product’s thesis, in one card
The journal snapshots the checklist at plan time and never rewrites it. The statistics screen then puts the two groups side by side. If either group has fewer than ten trades, the card refuses to draw a conclusion at all.
Discipline card — the shape it takes with enough data
Illustrative shape of the card. Your own numbers come from your own trades, and until each group holds ten of them the app prints “Not enough trades yet”.
What the journal records
Mechanically proven, not promised
“Offline” is easy to claim. In this app it is checked by a script before release: the built Android manifest is inspected for the internet permission, and the source is scanned for any networking API at all.
The two dependencies are the file picker and the documents-directory lookup. No chart library, no state library, no database, no analytics, no fonts fetched at runtime.
Straight answers
Three places, all offline: bundled sample series (badged SAMPLE), CSV files you import from your broker or charting platform, and prices you type by hand. Every price on screen carries its source badge and the timestamp of its bar. There is no “live” badge, because there is no live.
No. It evaluates the rules you wrote against the bars you loaded and marks where they fired. The results panel says, verbatim: “Historical check on the data you loaded. Not a prediction, not advice.”
No — it is not connected to a broker and has no network access at all. It is a desk for planning, sizing and reviewing; the execution stays wherever you already trade.
It stays in the app’s own folder on your device: JSON for accounts, trades, rules and drawings, one CSV per candle series. Nothing is uploaded, nothing is synced, and you can export everything or erase it all from Settings.
Comma, semicolon or tab; header or no header; columns in any order; ISO, dotted, slashed or epoch timestamps; decimal point or comma; BOM and CRLF. Every rejected row is listed with its line number and the reason — nothing is silently dropped or coerced.
None of the three. There is no sign-up, no paywall and no telemetry.
Coming to the App Store and Google Play.
Trading involves risk of loss. This app is an analysis and journaling tool, not financial advice.